Want to cover each stage of Bloom's in one activity?
Try infographics.
So we know we need to push our students to reach higher levels of thinking, but how do we do that? One place to start would be to incorporate infographics into your lessons. Not only do they simply look much more appealing than a traditional textbook page, but they pack a big punch in a cute package. Even better is the fact that having students create these graphics can take them from the Remembering level of Bloom's all the way to the top by Creating.
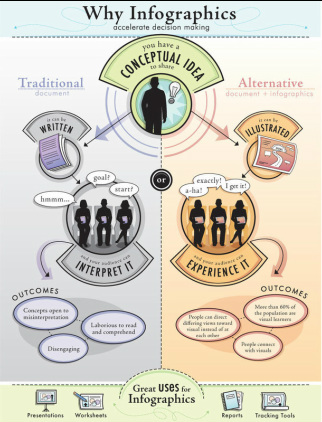
Still not convinced? Check out this infographic that will surely show you the power of images to display information.
Try infographics.
So we know we need to push our students to reach higher levels of thinking, but how do we do that? One place to start would be to incorporate infographics into your lessons. Not only do they simply look much more appealing than a traditional textbook page, but they pack a big punch in a cute package. Even better is the fact that having students create these graphics can take them from the Remembering level of Bloom's all the way to the top by Creating.
- Step 1: Students will have to gather and REMEMBER facts and information about a topic.
- Step 2: Students will then show UNDERSTANDING and APPLICATION of this new knowledge by representing it in a visual way, relating the facts with images.
- Step 3: Students will have to ANALYZE and EVALUATE the best way to display their information by separating out the most important details and then deciding which to showcase and how.
- Step 4: Finally, after climbing all the other stairs of the pyramid, students will CREATE a complete infographic that combines not only their basic knowledge of the content, but a true analysis and evaluation of what's most important.
Still not convinced? Check out this infographic that will surely show you the power of images to display information.
Use these links to inspire your students through both content and example
- Daily Infographic has a multitude of inspiring infographics that could be used to teach content or as great examples to show students before setting them loose to create their own. Be sure to check out the various categories for all your content needs.
- Take this virtual tour (and then show your students) to see an inforgraphic built from Step One. PERFECT TUTORIAL!!
- Another site with fabulous examples that could inspire students to create their own or provide you with a much snazzier way to present your lesson for the day.
- Visual.ly: Yet another source of infographics and a really cool name.
- Needing some more information about the whole idea of infographics? Check out this collection of links and resources (and save me the time of adding them here!).
- This LiveBinder could be your one-stop shop for great examples, links to lesson plans and ideas, and places to create your own.
Now that you're inspired, start making your own! (Or, better yet, have your students get to work!)
- A great site to start, this includes links to 5 Tools for Creating your Own Infographics.
- Easel.ly: Examples of great infographics, as well as a way to drag-and-drop to create your own.
- A FREE way to create your own infographics: Infogr.am
- This interactive periodic table of visualization methods can give you and students ideas on what type of graph or chart would best fit your set of data.
- Need data? This beyond-simple-to-use source is definitely the place to start.
